Dedicated Database System for Market & Competitive Intelligence
Simplify Your Market & Competitive Data Management With Our Dedicated Database System
The Midesk Databases, at the core of your Midesk workspace, are the ideal space for all your non-news data. Built on years of feedback from our clients, our refined architecture satisfies even the most challenging aspects of managing market data across various reporting periods, information sources, and currencies.
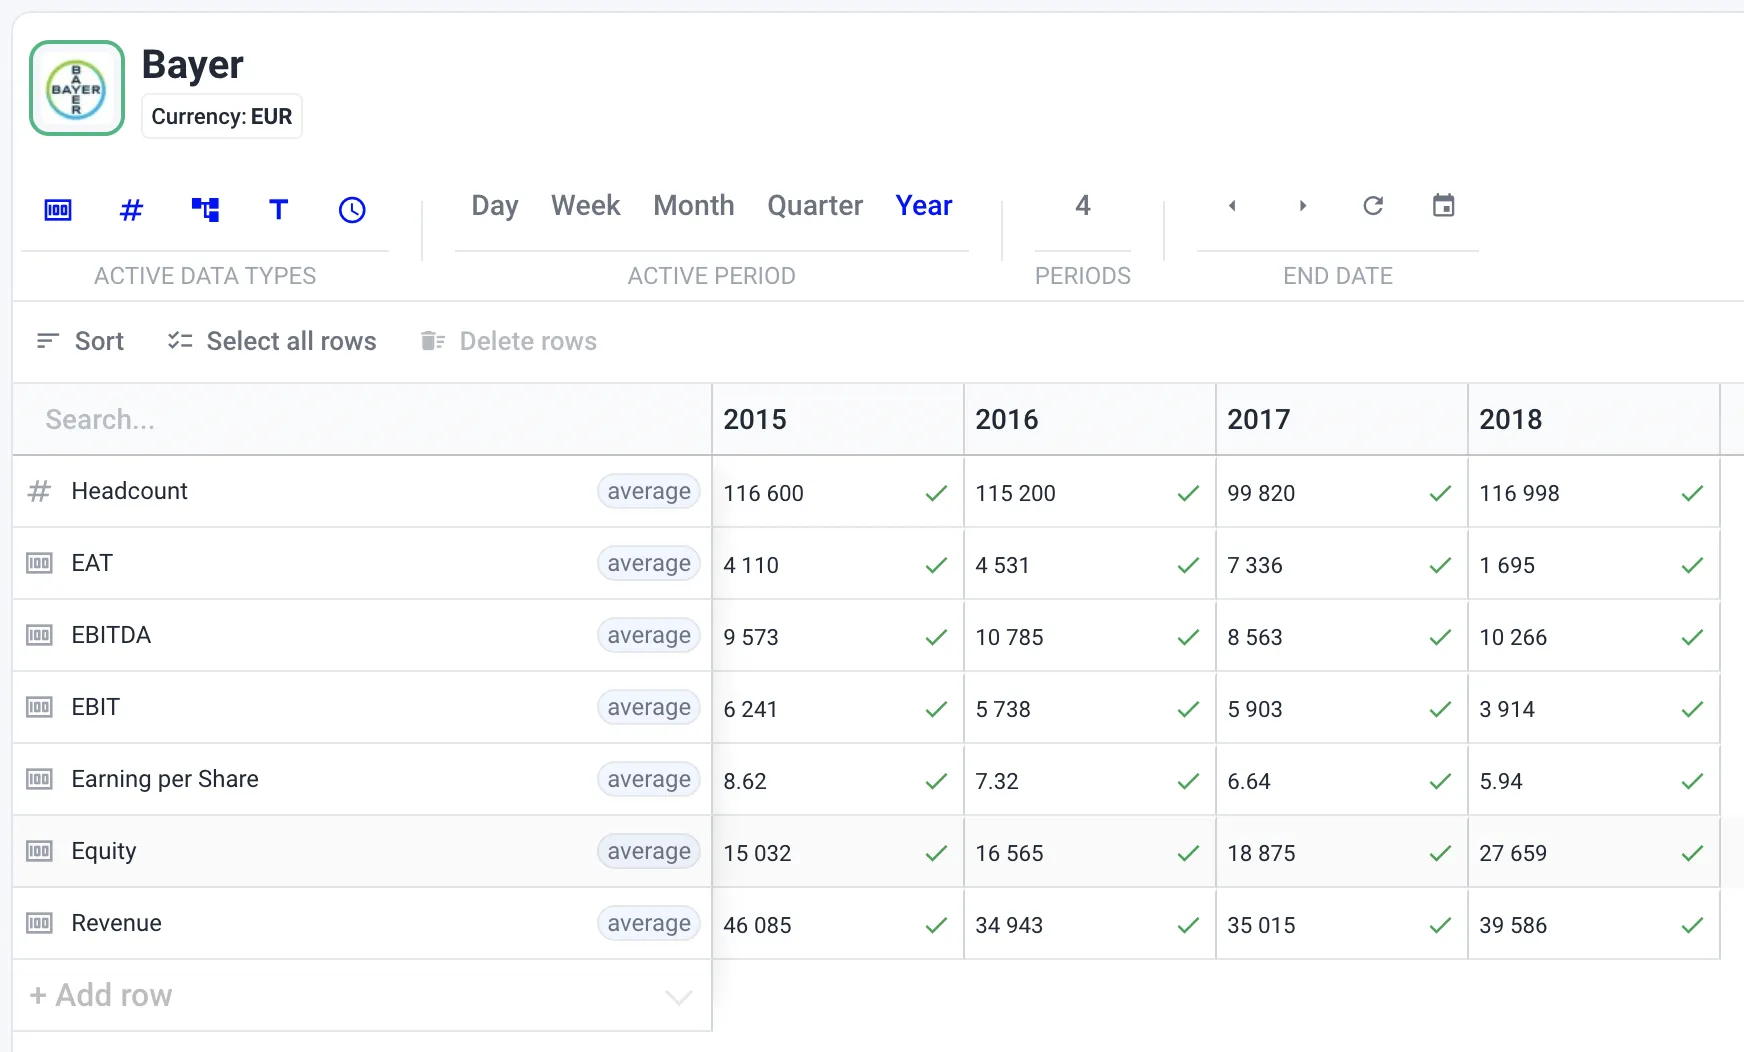
Efficiently Manage Data Across Various Reporting Periods
Managing data that represents specific periods such as daily active users, monthly sales targets, or annual consolidated revenue, is a common aspect of Market & Competitive Intelligence. Midesk offers a dedicated and proven solution to such common yet “niche” use cases.
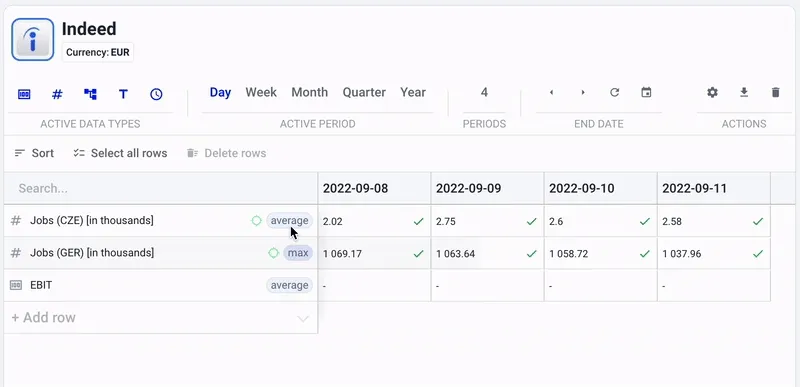
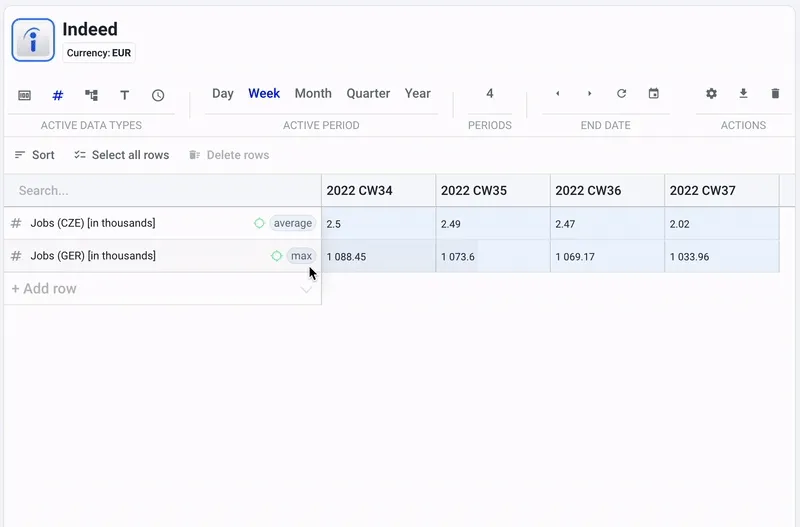
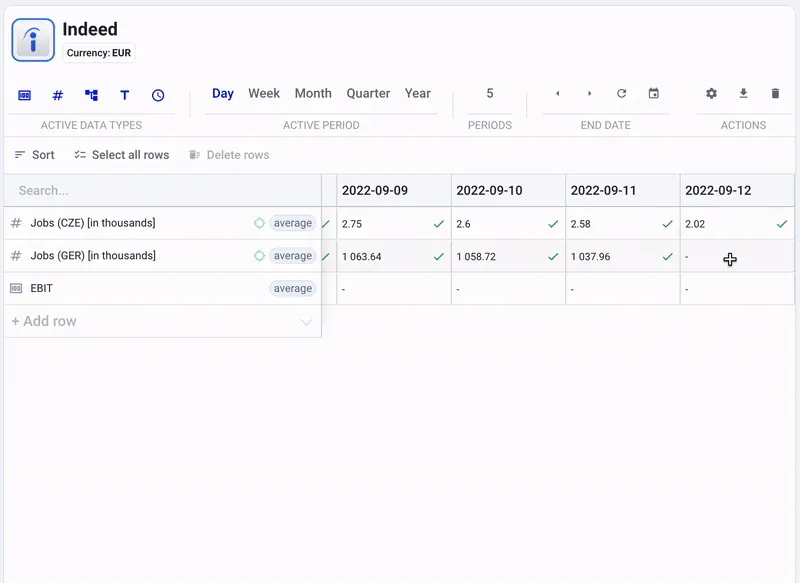
Intuitively Address Missing Values
Missing figures are common in Market & Competitive Intelligence. Midesk’s intuitive system simplifies dealing with figures that are not readily available or lie outside your preferred reporting period. We offer bottom-up calculations such as sum, average, min, max, and off, making the management of missing figures a breeze.
Streamline Information Source Management
Maintaining an organized approach to source information is crucial when dealing with market & competitive data. As the volume of data increases, managing information from multiple sources for the same reporting period can become challenging. Midesk’s dynamic solution ensures you can always accurately answer the question, “What’s the source of this data?”
Experience Enhanced Market & Competitive Intelligence
Midesk’s specialized Databases offer an integrated solution to manage market and competitive data. With Midesk, you can unify all your data management processes into one platform, letting you focus more on insights and actions, and less on manual data manipulation.
To understand how our databases interact with other capabilities, explore our Product offering. Experience how Midesk can redefine your Market & Competitive Intelligence.
See our solution in action
Let's discuss your particular Market & Competitive Intelligence needs and see how Midesk can address them.